The TAG Team Is
Here to Help!
We work closely with our prospective clients to determine the best level of support based on
goals and current perceived gaps.
Whether it’s a phone consultation, online training or onsite visits – we’re here to help you!

800.401.2239

Key Points
October 28, 2020
-
In Today’s Recommendation for Industry, we review the Risk Matrix and provide a snapshot of what is happening in the U.S. and how states are doing. Read more.
-
How can assurance testing of asymptomatic workers verify your COVID-19 Protection? Join us today (Wednesday 11/28) in our upcoming webinar with Dr. Ben Miller at 12:00PM.
-
For a more detailed look at specifics of each state’s opening and/or re-closing programs (including if bars, gyms, etc. are open or not), check out New York Times’ long summary.
-
U.S. counties that have enforced mandated public mask-usage policies have seen a decline in cases (even within a month) of enforcement; this is seen through two case studies, one in Kansas (in 20 of 105 counties with mandated mask policies, mandated counties saw half as many new COVID infections as those without mandated policies) and another in Arizona (a 75% drop in COVID-cases after mask-wearing was enforced and bars/gyms were closed). Masks are good! Wear them!
-
New research indicates that some COVID survivors have antibodies that, instead of attacking the virus, attack their own bodies, similar to autoimmune disorders. Find the study here. It’s also in the news.
-
The New York Times is interested in hearing from farmers, meatpackers, grocers and other essential workers who have kept the country fed throughout the pandemic. If you are interested in sharing your story, you may contact them here.
-
In Case You Missed It:
-
On Monday, we discussed the most recent record of reported U.S. COVID-19 cases and what that might mean.
-
Last Friday, we revisited and clarified the CDC’s revised definition of “close contact.” Read more here.
-
A recent Nature article discusses the positives and negatives of using pooled testing, including optimal group size and sampling frequency.
-
A large U.S. and Canada study showed that lower COVID-19 viral loads are found in asymptomatic children. However, asymptomatic children with diabetes who had recent close contact with a COVID-19 infected individual did have the highest viral load. Read more here.
-
CIDRAP has summarized two recent studies on convalescent plasma from recovered COVID-19 patients. From the two studies, there has been no benefit by using convalescent plasma; in fact, there may be a risk leading to blood clots.
-
The FDA has approved its first U.S. treatment for COVID-19, the antiviral drug Veklury (also known as remdesivir) to be used in adults and pediatric patients over 12 years of age “for the treatment of COVID-19 requiring hospitalization”. At this time, the WHO does not believe remdesivir is an effective treatment.
-
With Halloween fast approaching: the CDC has provided new Trick-Or-Treating & Halloween Preventive Measures & Alternative Activities (pdf) and Steps to Take for Other Halloween Activities.
-
OSHA is offering no-cost, confidential occupational safety and health services to small and medium-sized U.S. businesses. Find out more here.
-
-
Are there any topics or questions that we have not covered yet or did not expand on, previously, regarding COVID-19? Do you have any questions that we haven’t answered yet about COVID-19 and its impact on your business? If so, leave us a message and let us know.
Recommendations for Industry
U.S. On a Negative Trajectory
The Acheson Group’s U.S. Risk Matrix has calculated an Outbreak Index using a series of variables that include Test Positive Rates, Effective Rates of Transmissions, and Social Distancing Values. Through this, the Risk Matrix identifies states in various quadrants from Lower Risk to Highest-Risk.
This week’s Risk Matrix does not look good for most states in the U.S.. Almost uniformly, every state in the U.S. is in a worse place than we were a week or two ago. The trajectories are bad. TAG is regularly being asked, “What more can we be doing?” We do need to keep up all the protections – and make sure your people are wearing masks, social distancing, washing hands and sanitizing – on and off-duty. Where rates of illness are high in the surrounding community, testing asymptomatic employees can help verify your prevention programs and identify clusters of illness before a large outbreak occurs.
As of October 27, 2020, 30 states are in the Highest-Risk Quadrant (Outbreak Index > 50). This is up from last week’s 23 states. States in the Highest-Risk Quadrant are Alaska, Alabama, Arkansas, Arizona, Colorado, Delaware, Florida, Georgia, Iowa, Idaho, Illinois, Indiana, Kansas, Kentucky, Minnesota, Missouri, Montana, North Dakota, Nebraska, New Mexico, Nevada, Oklahoma, Oregon, Pennsylvania, Tennessee, Texas, Utah, Wisconsin, and Wyoming.
The average U.S. Mobility Index increased from 5.9% (last week) to 6% (this week), indicating a slight decrease in mobility throughout the U.S
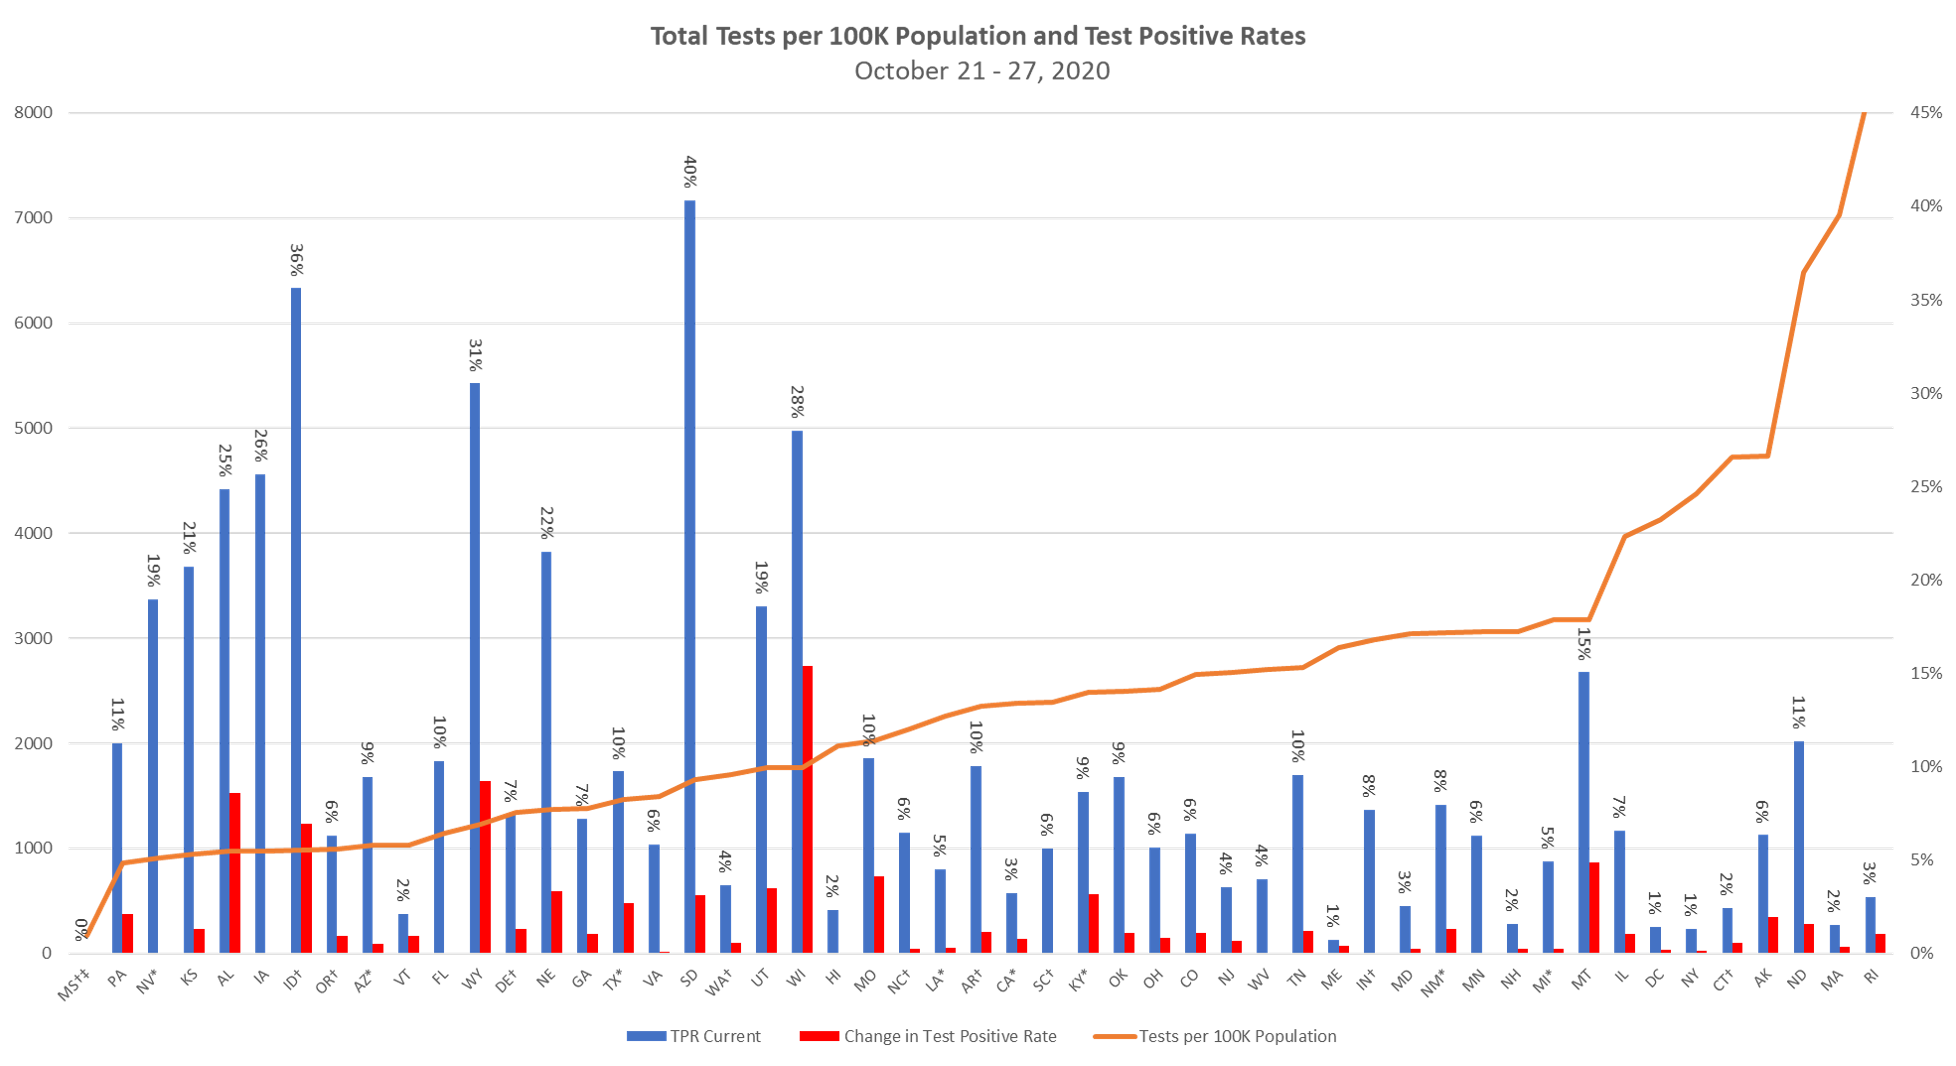
As shown in Table 1, TAG has calculated that Thirteen (13) states have a TPR greater than 10% indicating the current level of testing may not be fully characterizing the severity of the outbreaks in these states. These states are:
-
South Dakota: 40%
-
Idaho: 36%
-
Wyoming: 31%
-
Wisconsin: 28%
-
Iowa: 26%
-
Alabama: 25%
-
Nebraska: 22%
-
Kansas: 21%
-
Nevada and Utah: 19%
-
Montana: 15%
-
North Dakota and Pennsylvania: 11%
Table 1.
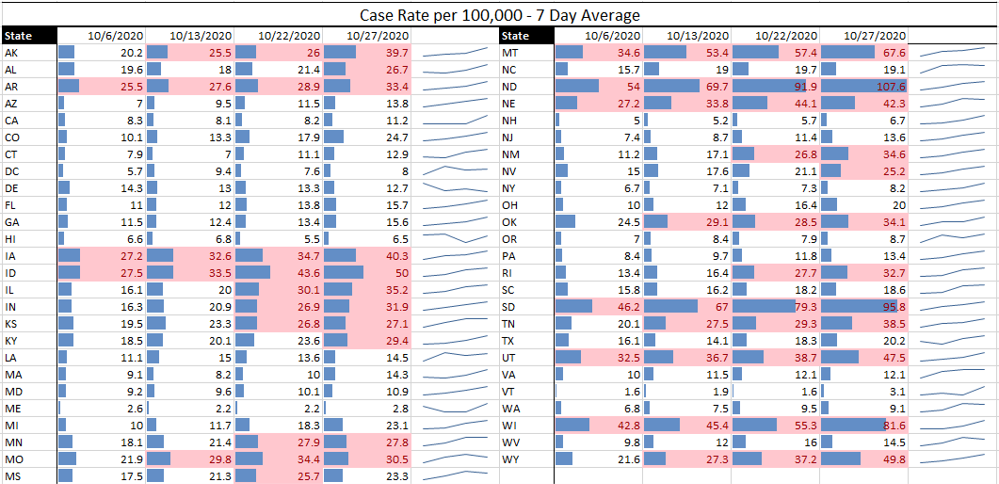
We also have displayed a table the past 4 weeks of case rates/100,000 persons per state, showing how outbreaks may be expanding and/or contracting in different states (Table 2). Case rate information is useful for identifying trends over a 2- to 4-week period. This information allows for relative risk comparisons to be made among regions and plants. This analysis calculates a 7-day rolling average of the number of cases per 100,000 people in the regions. A case rate >25 would indicate that an outbreak is uncontrolled and strict measures be undertaken to ensure safety of site and/or people (as highlighted in red with red text on the graph).
TABLE 2 - U.S. Case Rates / 100K Population

Outbreak Updates
As of October 28, 2020 (11:07 ET), there are over > 44,093,000 cases (>1,168,000 deaths) worldwide.
Due to the increasing number of cases in the United States, TAG will move from reporting counts per country to focus on the United States, please see here for the data. For further information regarding worldwide numbers, please refer to John Hopkin University’s aggregate map.
Keep up to date with COVID-19:
Please send us any questions, comments, and/or concerns! We are happy to talk with you.

OR call us at 1-800-401-2239
Get the Insights & Guidance You Need!
Learn how TAG can help your company ensure food safety and brand protection.
Contact us today!